Conversion rate optimisation does not start with testing button colours, it starts with finding where visitors give up. This piece gives the order: measure which step of the funnel is losing people, fix that step, and only then test. Teams working in the reverse order run tests for months while the conversion rate stays flat, because what they are testing is not where the problem is.
1. Conversion is low: what to look at, in order
The overall conversion rate on its own says nothing, because it contains traffic that behaves in completely different ways. The first job is to split it.
- Split by device. The gap between mobile and desktop is more than double at most stores, and the average hides it.
- Split by traffic source. Someone arriving from a brand search and someone arriving from a display ad do not see the same page with the same intent.
- Separate new from returning visitors. One average conceals two different problems.
- Then break the funnel into steps: product view, add to basket, begin checkout, order. The step with the largest percentage loss is the only step to work on.

2. The product page: where the decision is really made
If the add-to-basket rate is low the problem is almost always here, and it is almost always missing information. Customers leave because they cannot decide, not because they were unconvinced.
- Size and fit: the number one cause of returns and abandonment in apparel. The size chart belongs on the page, not behind a link.
- Delivery time and cost, next to the price. A shipping charge that appears at checkout is the most classic reason for abandonment there is.
- The returns policy, short and plain. “Free returns within 14 days” should sit exactly where the hesitation happens.
- Enough images: one that gives scale, one showing it in use, one that shows the texture. A single studio shot is not enough in most categories.
- Honest availability. Leaving a sold-out variant selectable moves the visitor forward for nothing.
Most of that information is already in your product data, or should be. To see which fields are missing product by product, use the free feed analysis: more than 30 checks run per product and the gaps come back graded and ranked.
3. Basket and checkout: the real reasons for abandonment
Basket abandonment is a symptom, not a behaviour. Its causes can be listed, and most of them can be fixed.
- Unexpected cost. Shipping, tax or a service fee appearing at the last step feels to the visitor like the price changed. Show the total from the start.
- Forced account creation. Closing off guest checkout loses the first-time customer outright.
- Long forms. Every field not needed to fulfil the order is an opportunity to give up. Date of birth and a second phone number are unnecessary in most stores.
- Missing payment methods. A customer who cannot find their preferred method does not try the alternative.
- Vague error messages. “Something went wrong” tells the customer nothing about what to do and ends the session.
4. Mobile is not a smaller desktop
If most traffic is mobile and the conversion rate is half the desktop one, the loss is in a few specific places.
- The add-to-basket button should stay on screen. A user scrolling down a long product page should not have to hunt for it.
- Form fields should open the right keyboard. A letter keyboard on a phone number field costs every customer a few seconds.
- Touch targets need to be large enough. Small variant buttons side by side produce wrong selections and returns.
- Go easy on overlays. A newsletter popup that appears as the page loads is the most common reason someone hits back on a phone.
5. Speed: not losing the click you paid for
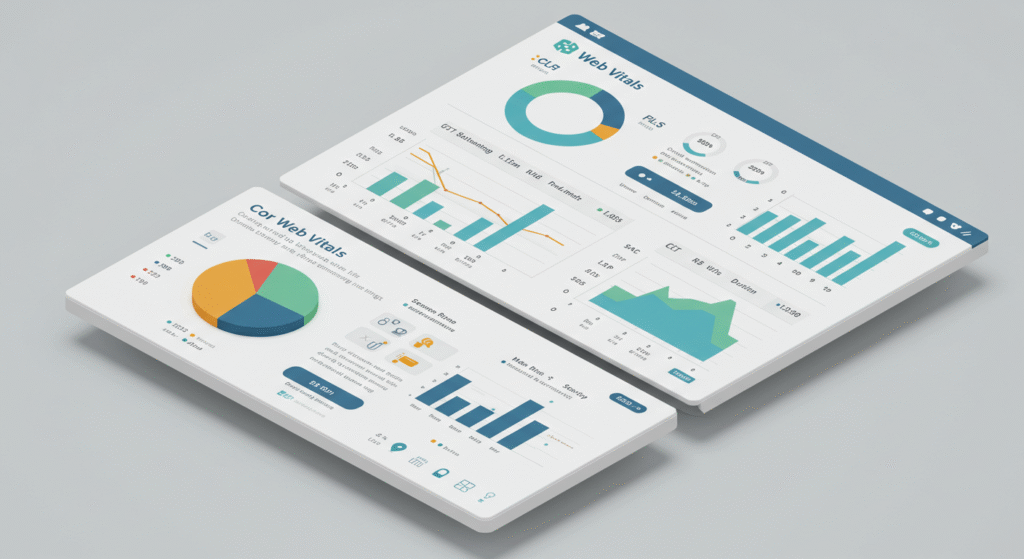
Speed is not a technical detail, it is the direct counterpart of the ad budget: the click of a visitor who leaves before the page renders has already been paid for.
- Read field data, not a lab score. The field data in Search Console shows what visitors actually experience.
- The biggest win is usually in the images. A modern format at the right size makes a visible difference on its own.
- Count the third-party scripts. Every new tracking or chat tool adds cost to the load. Removing the unused ones is the cheapest improvement available.
- Measure layout shift. A page that moves while it loads causes wrong taps and loses trust.
6. Search and navigation
A visitor who uses site search knows what they want, and their conversion rate is usually far above average. Which makes the quality of the search box a revenue line rather than a navigation detail.
- Read the no-result searches weekly. Either a gap in the range or a vocabulary mismatch, and both are fixable.
- Tolerate typos. A search that returns nothing over one letter turns away a sale that was ready.
- Filters should suit the category. Size for shoes, dimensions for furniture, skin type for cosmetics. Giving every category the same filter set does not work.
7. When to test, and when to just fix it
Putting every change through an A/B test wastes time at a small store. The distinction is clear.
- Just fix: anything broken, missing or wrongly worded. You do not need a test to tell you that hiding the shipping cost is bad.
- Test: when you are genuinely between two reasonable options. A different layout, a different offer, a different sort order.
- Do not test without the traffic. A test that cannot reach the volume it needs will have you reading noise as a result.
- Do not stop a test early. The variant ahead in the first few days is usually just ahead by chance.
8. What to read every week
Conversion optimisation is a routine rather than a project. Four things to read weekly, and all four belong in a report rather than on a screen somebody has to remember to open.
- Conversion rate by device, not as one average. A slide on mobile can stay invisible in the total for weeks.
- Errors at the payment step. Cards a provider is quietly declining are the most frequently missed cause of a drop in sales.
- The top ten site searches with no results. The cheapest source there is for both a content plan and a stock plan.
- The five most-viewed, least-sold products. That list ranks the product pages to work on by itself.
Setting an alert on those four is far more reliable than waiting for someone to look at a dashboard. The moment a metric matters is usually the moment nobody has the report open.
Frequently asked questions
What is a good conversion rate?
There is no comparable industry average, because the figure moves with price point, decision length and traffic mix. The only meaningful comparison is your own last quarter. A target taken from outside is usually a number from a different business.
Are heatmaps and session recordings really necessary?
Analytics shows you where you are losing people, recordings show you why. Those are different questions. Watching recordings before you know which step is losing them is wasted time; once you know, ten recordings of that step usually show the reason outright.
Invest in traffic or in conversion first?
Conversion usually comes first, because it makes every click you buy worth more. But if you do not know which step of the funnel is losing people, set up measurement before investing in either. If you want someone to do both together, look at our consultancy side or write to us.